Nexus Homelab
I wanted to host my own services and learn how networking, storage, and security fit together on a real server.
I built a Linux homelab with Docker services, RAID storage, and a custom dashboard that gives me one place to find them.
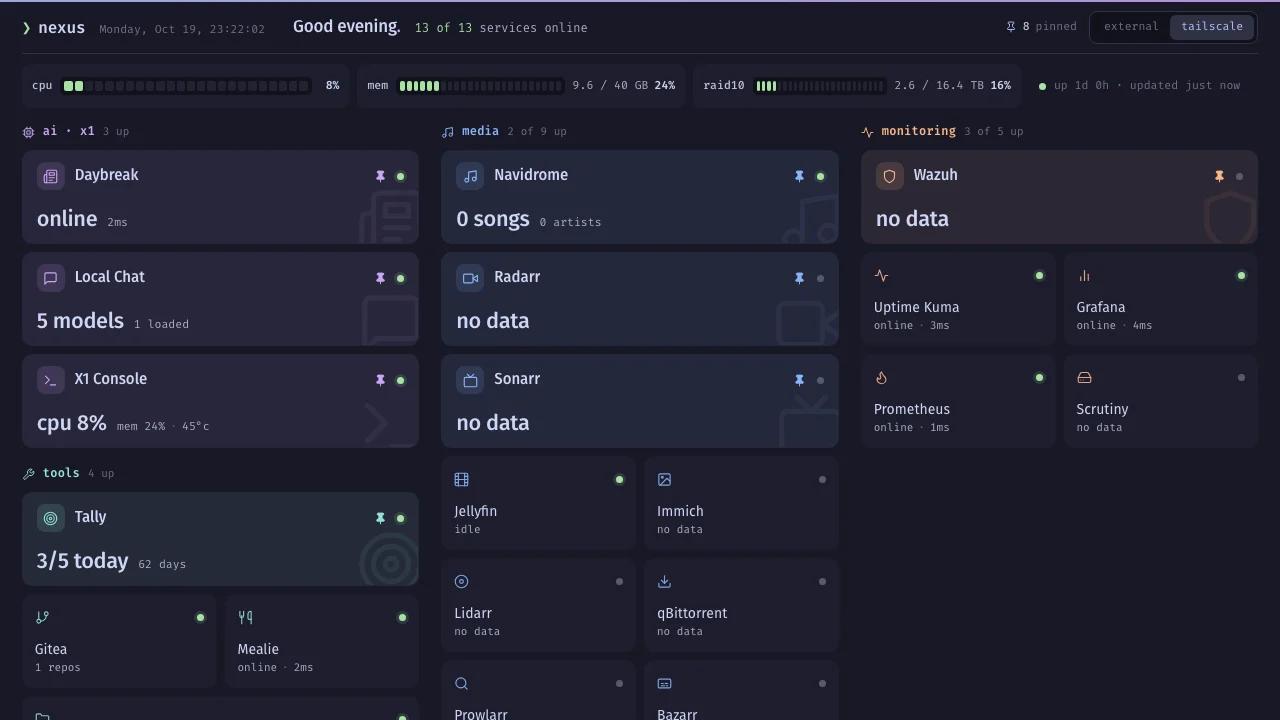
how it works
- A Dell OptiPlex runs Linux and Docker, with mdadm RAID 10 across four enterprise drives.
- Tailscale connects Nexus, the X1, and the VPS.
- The custom Flask homepage groups services and polls their health endpoints.
- Prometheus scrapes host and container metrics through node-exporter and cAdvisor, and Alloy ships logs to Loki. A Wazuh manager on Nexus receives events from agents on Nexus and the VPS.
decision
Nexus has no public IP and no forwarded ports. Public traffic reaches a small cloud VM first, which terminates TLS and drops banned IPs before anything crosses the Tailscale mesh to my house.
what went wrong
CrowdSec banned my own uptime monitor, because checking every service each minute looks like a scanner. Unbanning it only lasted until the next check, so I added a whitelist that skips detection for that source.
outcome
Nexus runs 25+ self-hosted services, including Daybreak’s reading app. Its metrics, logs and security events all land on Nexus. Grafana is connected to those sources, but I have not built its dashboards yet.
Docker, Linux (Kali), Tailscale, Nginx, CrowdSec, Wazuh, Prometheus, Grafana, Loki, Ollama, Flask, SQLite
How my home server hosts eight websites with no open portsI built my homelab on a $200 Dell OptiPlex
Screens and a walkthrough
Find a service and check the server at a glance.
0:21 · silent, with on-screen explanations
read the walkthrough
- Check the dashboard. Start with the service dashboard. Each tile opens one of the tools hosted in the lab.
- Browse the services. Scroll through the groups to find reading, media and server tools.
- Check the status. Return to the overview to check usage and service availability. These readings are sample data.